

Hi All,
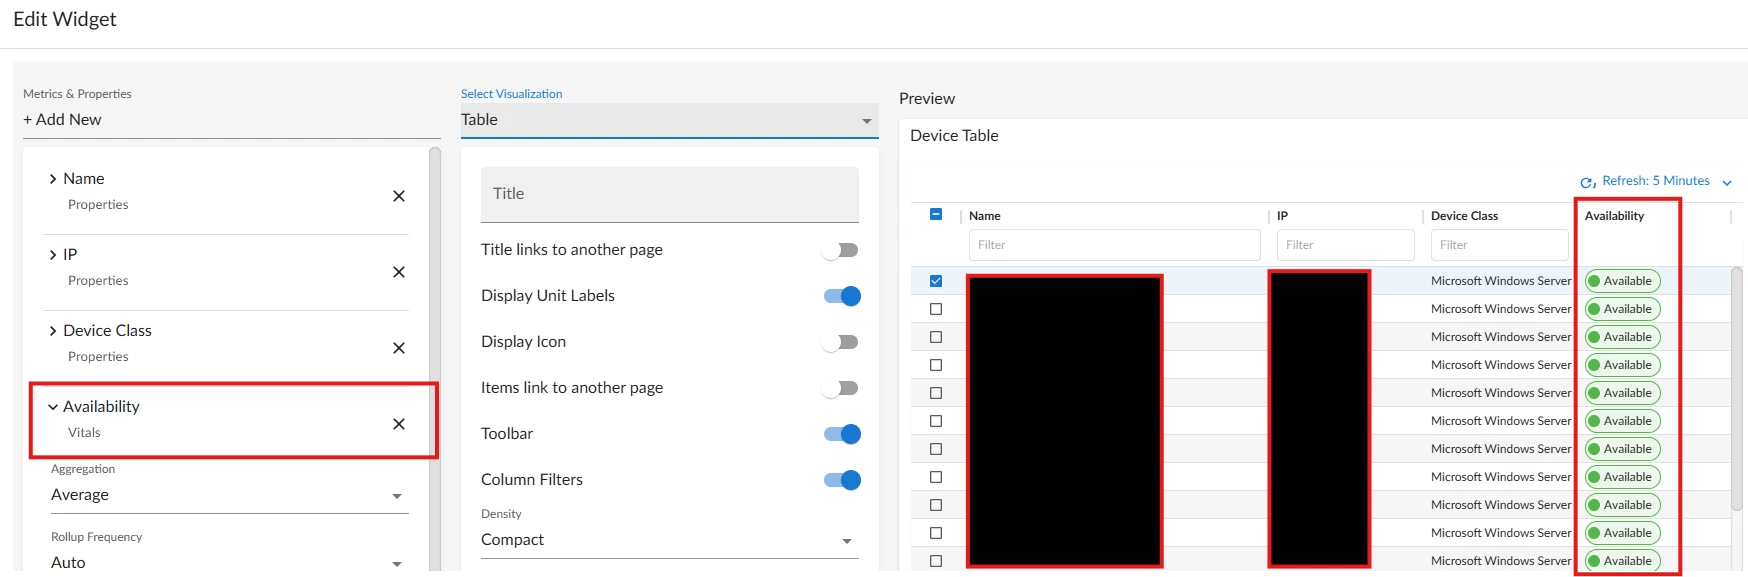
I have a request to show a list of servers with a column that shows the % of Availability (successful polls) over the time period that is selected in the dashboard. When I add the metric “Availability” from the Vitals selection, it simply shows a current state (Healthy/Minor/Major/Critical). Is there an way to show a heatmap or percentage (leaderboard would be best!) of server availability percentage?