
Hi
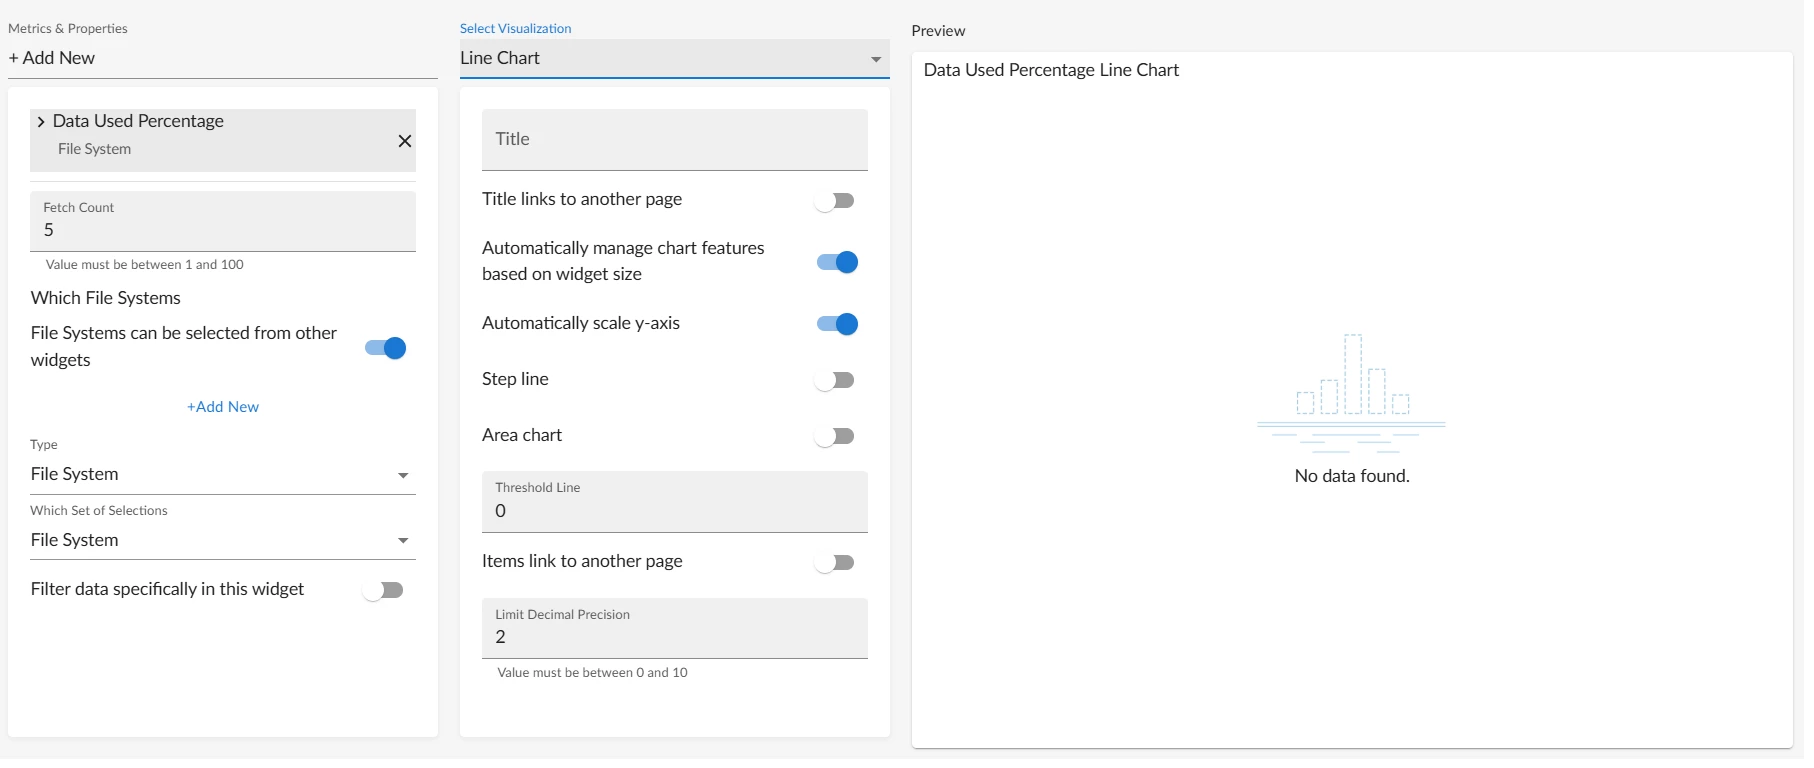
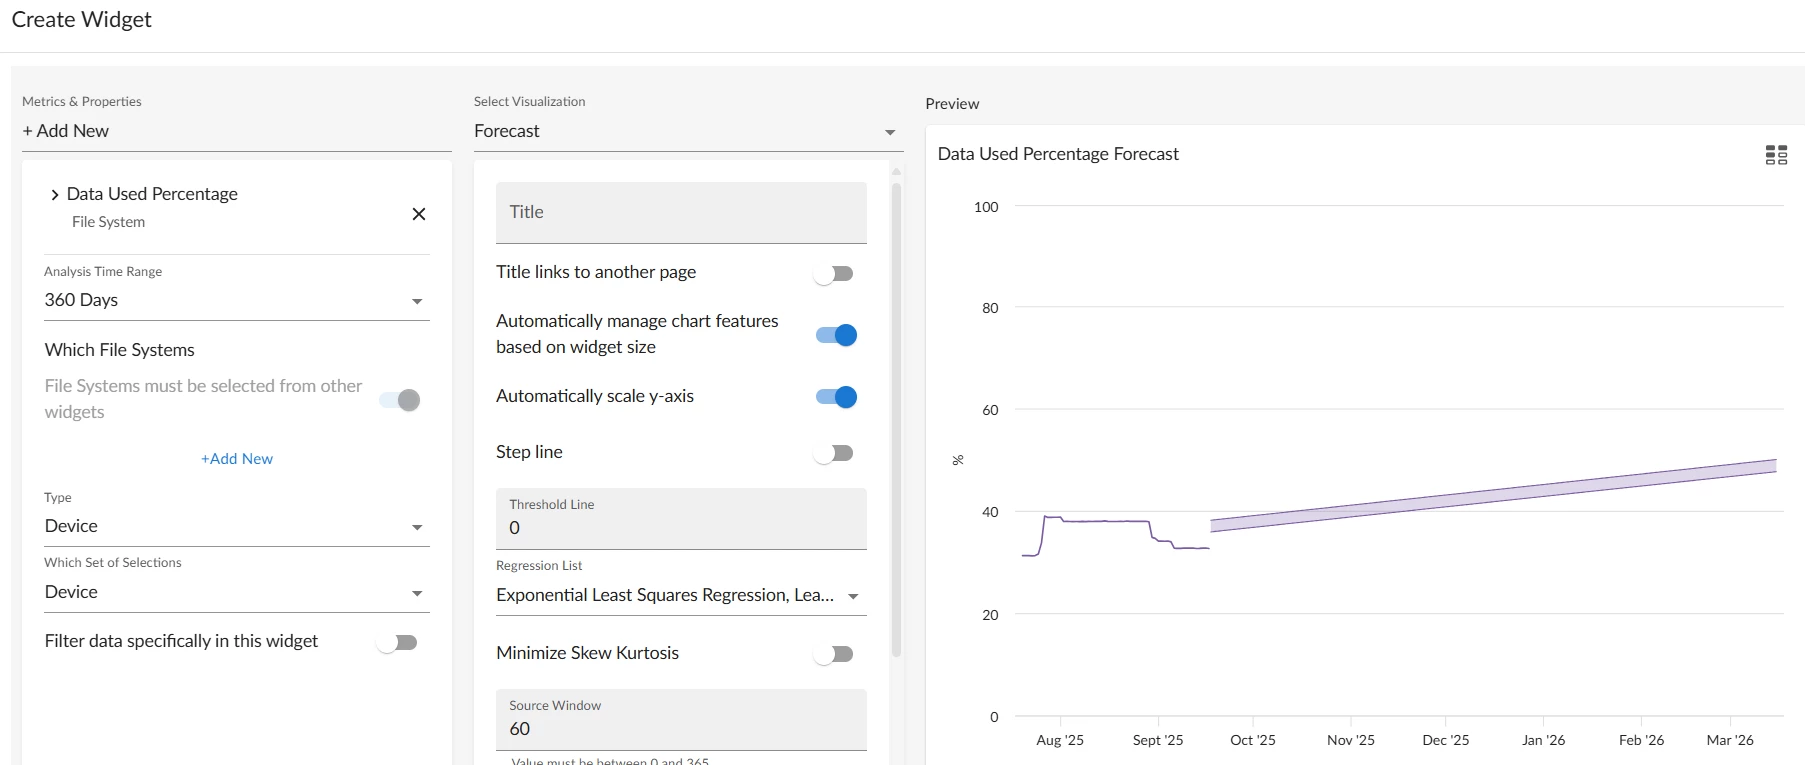
I'm trying to present a line chart for all disks on a windows server over the time period selected within a dashboard. We can view a graph with the visualization set as forecast but no data can be found for a linechart. It also only shows one value rather than for each disk.
How can we show disk usage over time within a widget?