Geographic Maps in Skylar One
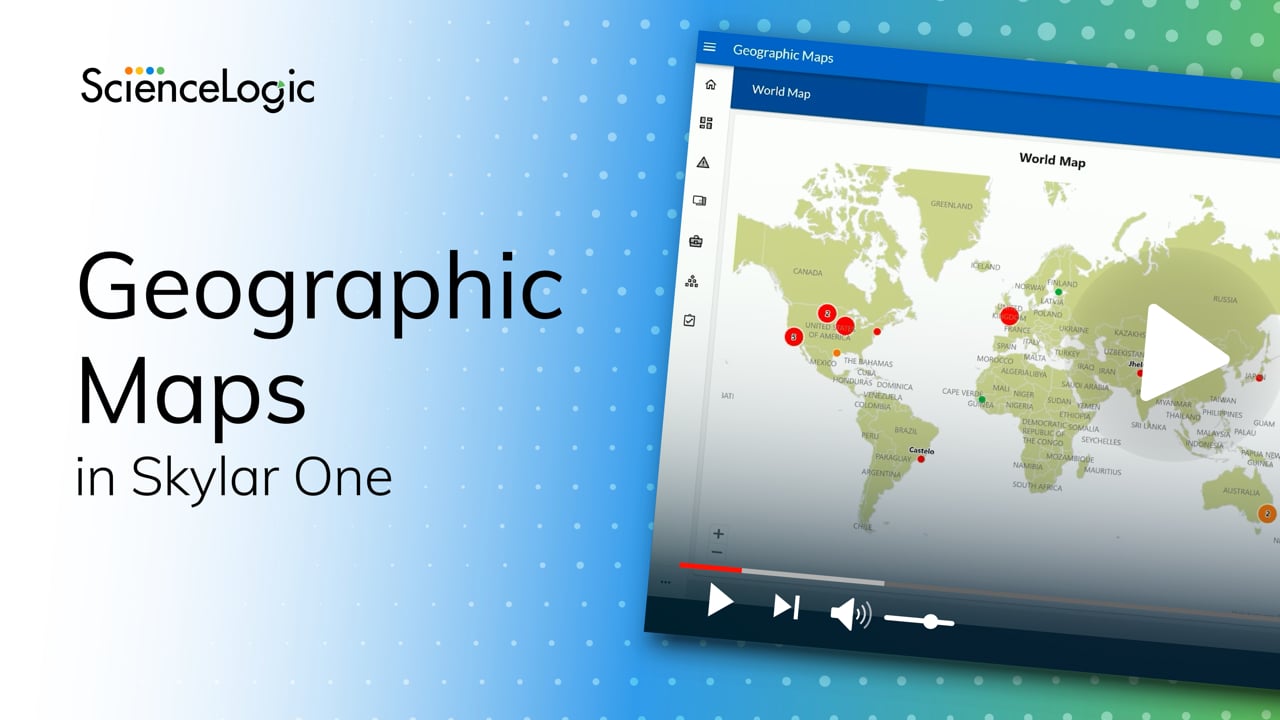
ScienceLogic Principal Product Manager Jonathan Chivers introduces the first release of Geographic Maps in Skylar One, a new capability that brings location intelligence to IT operations. Geographic Maps allows users to ingest and align location data with devices, then automatically place them on an interactive map based on known locations. This helps operations teams quickly understand the health and scope of their environments, whether local, regional, or global. Built for NOC teams, analysts, and technology owners, Geographic Maps improves situational awareness and supports faster issue resolution. Jonathan also highlights what’s next on the roadmap, including Business Services mapping, high-fidelity zoomable maps, and location management directly within the Skylar One interface.84Views6likes0Comments
Doubt and questions about Global Manager
Hi to all, we configured a Global Manager in our QA env for 2 stacks but there is something that it's not really clear to me. The global manager is not capable to manage PP on the stacks (in AP2 UI there is any menu entry for PP), is not capable to retrieve device groups defined on the stacks, is not capable to retrieve device class from the stack, is not possible create device groups and add devices monitored by the stacks. My first question is: how can we create a dashboard that can filter panels based on custom device group?61Views3likes4CommentsUsing Skylar RCA for Root Cause Analysis
This article assumes you already have a Skylar RCA account. If not, please contact your CSM for a 30-day trial of the product. Step 1: Contact ScienceLogic support to obtain a copy of the OTel collector. Step 2: Install the OTel collector as per installation steps (see the references section below) Step 3: Update the OTel configuration file. This is the otelcol.yaml file in otelcol-sciencelogic-zebrium_x86_64 directory. The following fields will need to be updated Include attribute in filelog block to match the log file location(s) regex in operators > type block. This needs to match the log file format. As a best practice, use a regular expression checker (for example, https://regex101.com/ , to check your regular expression before updating the configuration file endpoint and ze_token sections in the exporters block. These need to be copied from your Skylar RCA instance Step 4: Before sending logs to Skylar, it is recommended configuration is tested with local debugging. This can be achieved by using exporters: [debug] in the service: pipelines: logs: section of the otelcol.yaml config file. Also, in the receivers: filelog: section, add the line start_at: beginning to force the collector to read logs from the beginning. This will generate a log file in the logs sub-directory. Step 5: Restart the SciencelogicZebriumOpenTelemetryCollector service. Step 6: Once you are happy with the debug output, modify the config file so that logs will be sent to Skylar RCA. Remember to Restart the SciencelogicZebriumOpenTelemetryCollector service. Step 7: After a few minutes, check the Ingest History on the Skylar UI (in Ingest-history) to verify data is being received. Also, Diagnostics menu can provide useful information about how many log lines were received in the last 4 hours. Go to the Diagnostics menu and click on ‘Run Now’ button. References: Skylar Automated RCA documentation: https://docs.sciencelogic.com/latest/Content/Web_Zebrium/home_RCA.htm Windows OTel collector: https://docs.sciencelogic.com/latest/Content/Web_Zebrium/03_Log_Collectors_Uploads/Windows_OTel.html129Views3likes0CommentsSkylar One Juneau: More Speed. Better Maps. Smarter Topology. Happier Weekends.
When customers help guide the roadmap, the result looks a lot like Juneau (12.5.1). It’s practical, focused, and full of improvements you asked for. And while this version introduces new marquee features, Skylar One (SL1) customers are more likely to notice how it brings together hundreds of customer-driven engineering upgrades. The result is something admins, operators, and SREs will recognize instantly: a platform that runs faster, models the world more accurately, and fits easily into the rhythm of how you operate. With 700+ enhancements across ingestion, topology, eventing, collectors, HA, UX, and hardware support, Juneau is one of the most customer-driven releases we’ve delivered. These changes come straight from real deployments, break/fix pain points in the field, and hands-on sessions with SEs, Support, and Professional Services. And of course, huge thanks to the brilliant members of the Nexus User Community and all your contributions to the Nexus Idea Hub. Let’s dive into a few highlights from Juneau. A Platform That Feels Faster (Because It Is) Juneau’s performance improvements aren’t theoretical. The ingestion and data processing pipelines now move up to 60% more throughput, thanks to extensive tuning and backend re-architecture. In large environments, this directly translates into smoother dashboards, more up-to-date metrics, and fewer ingestion bottlenecks under unusually heavy load. Daily data maintenance was also rebuilt to use far less CPU and I/O, eliminating one of the most common sources of delay during maintenance windows. For large deployments, this means more predictable performance and smother scaling to peak load. In short: the system breathes easier. And as you already know, when goto ops tools run faster, the entire operational experience improves. Topology That Matches the Networks You Run Topology modeling has always been one of SL1’s superpowers and Juneau gives it a serious upgrade. LLDP and CDP relationship extraction got a ground-up refresh. One of the most impactful changes: LLDP now forms multiple valid relationships across interface pairs instead of aggregating them into one. Bonded links, trunk groups, and redundant uplinks now show up exactly as they exist in the environment. Similarly, topology can now form relationships even when only one side of the connection reports neighbors. For environments with asymmetric discovery policies, strict security controls, or devices that don’t speak every discovery protocol, this is a major practical improvement. You now get a more complete graph, even when the inputs are less than perfect. Add in new global controls for per-protocol behavior, and discovery becomes far more adaptable to the real world — not just an ideal one. Geographic Maps: A New Operational Lens Juneau introduces Geographic Maps as a new data & visualization type, and a new dimension to operational awareness. You can now visualize devices, services, and health states geographically across regions, campuses, data centers, cloud footprints, retail branches, or industrial sites. Here are just a few customer use cases: MSPs validating customer regions Retailers preventing brick-and-mortar outages Energy and utilities tracking state-level impact Distributed enterprises troubleshooting local vs. regional issues And many more… Skylar One Geographic Maps isn’t simply NOC bling — it’s a diagnostic tool. Geographic Maps surface real-world patterns that don’t always fit neatly into lists or dashboards. They make regional correlation simple. And even better, they turbocharge understanding for business services and synthetics. We can’t wait to see how you’ll take advantage of geo-aware data and visualization. And yes, automatically zooming, context-aware, full-screen Global Ops maps do make for sparkly NOC bling. Event Policy Editor: Redesigned by You Juneau includes a new Event Policy Editor that streamlines the configuration and optimization for event policies based on your feedback. The new UI is cleaner with an optimized layout and validates changes in real time. It’s easier to ensure accuracy, faster to build policies, and easy for new admins to learn. Business Service policy tuning also benefits from the same treatment, with clearer rule logic and intuitive metric selection. If you manage complex event pipelines or regularly onboard new operators, this is a quality-of-life upgrade you’ll notice immediately. AI Observability from Model to Metal (Now with AMD GPUs) Believe it or not, self-managed AI infrastructure isn’t niche anymore — it’s becoming core to how advanced operations teams ensure tight AI security and cut cloud opex. Juneau expands Skylar One’s existing NVIDIA GPU and LLM workload monitoring to include full AMD GPU visibility, completing true model-to-metal observability. You get insight into GPU temperature, utilization, memory pressure, power draw, error states, and other AMD-specific signals, all stitched into the same service context that already connects your models, inference endpoints, OS behavior, and chassis health. For teams managing AI platforms, this is welcome news. For example, you can now measure the relative efficiency of specific AI workloads across different combinations of datacenter components and recommend the most cost-effective mix to maximize LLM performance for your operations. If you’re running LLM inference nodes, GPU training clusters, HPC pipelines, or any data-intensive workloads, this enhancement further extends the ScienceLogic AI Platform’s comprehensive observability. Skylar One now interprets the entire AI stack as a single, coherent system — from model behavior to GPU thermals to the infrastructure beneath it. It’s the same level of intelligent, correlated insight you expect for CPUs, networks, containers, storage, cloud, and more, now fluent in even more of the most performance-sensitive workloads you operate. Synthetics Become a First-Class Citizen in Juneau For a long time, synthetic tests in Skylar One were powerful but lived a little off to the side. They were easy enough to integrate but not fully woven into workflow. With Juneau, synthetics become a first-class citizen in Skylar One. Recording a synthetic transaction now feels familiar to anyone who’s used a modern DEM tool: record an application workflow in a browser via Playwright Codegen, drop the generated Playwright script into a Skylar One dynamic app, assign a credential, and you’re ready to test from multiple locations. Just record, point, click, run. But the real shift happens after you deploy synthetic tests. Because they’re now fully integrated into Skylar One, real-world application performance shows up everywhere operators already live — dashboards, business services, context panels, service health, and even Geographic Maps. Multi-location failures become much easier to troubleshoot when you have quantifiable experience data from an end-user perspective. And yes: Skylar One still works seamlessly with your existing DEM, RUM, and APM investments. If you rely on browser-based monitoring from Dynatrace, New Relic, AppDynamics, or others, Skylar One can continuously ingest and contextualize those signals too. But with the Juneau release, external tools are no longer required. Synthetic visibility is built in and part of the core platform experience. For teams who depend on predictable user journeys, distributed site uptime, or multi-step workflows, synthetics in Juneau aren’t just easier to run. They’re now part of the operational heartbeat of Skylar One. High Availability, Low Maintenance Some improvements don’t need a spotlight — they just work the way you expect. Improvements to High Availability is a perfect example. If you’ve ever stared at any application during failover and quietly wondered, “Is it switching… or just thinking about it?”, you’ll appreciate Juneau’s enhancements to Skylar One’s High Availability. This release tightens the entire HA failover path. Link-state detection is faster and more accurate (especially in environments without crossover links). Heartbeat monitoring is more responsive. Cluster state transitions settle quickly. And the updated logic avoids unnecessary retries that slowed down election decisions in some configurations. The result is HA that kicks in quickly, transitions reliably, and behaves with the no-fuss confidence you expect from tier-1 enterprise platforms. Python 3 Everywhere: Faster, Safer, and Ready for What’s Next The Juneau release completes Skylar One’s transition to a pure Python 3 platform. Collectors, platform services, dynamic apps, extensions — everything now runs on a single, modern runtime with no legacy paths or dual execution. Python 3 is industry standard for good reasons. It’s faster, more secure, and far better supported by modern libraries and tooling. Moving to a single runtime improves workload performance, strengthens security posture across the platform, and simplifies everything from dynamic app development to upgrades and long-term maintenance. Deprecated Python 2 powerpacks are clearly indicated in the admin UI so teams can identify and update any remaining artifacts with ease. Skylar One Juneau — Ready for You, Ready for Anything Juneau brings meaningful improvements across the features of Skylar One that operators depend on most. Faster ingestion, sharper topology, integrated synthetics, Geographic Maps, streamlined HA, full-stack AI observability, and a fully modern Python foundation come together in a release that’s more capable, more responsive, and more aligned with how your team works. It was engineered with customer input at its core, RC tested in user environments, and ready to support the next wave of your AIOps workflows. Check out the Getting Started Guide for more details and documentation links. We can’t wait to get your feedback on the latest release from ScienceLogic.61Views2likes0CommentsIntroducing the New ScienceLogic AI Platform – ScienceLogic's Next Era in Observability, Automation, and AI
At Nexus Live on October 8 th , we announced an important evolution of the ScienceLogic AI Platform: a new, unified naming convention under the Skylar™ name. This rebrand highlights our commitment to clarity and represents the investments we’ve made to deliver an industry-leading observability platform powered by visionary AI technology. What’s Changing The ScienceLogic AI Platform offerings are now: Skylar One (formerly SL1) Skylar Compliance (formerly Restorepoint) Skylar Automation (formerly PowerFlow) Skylar AI: Analytics (no change) Skylar AI: Advisor (no change) Skylar AI: Automated RCA will be retired as a standalone offering. Its capabilities will be integrated into upcoming Skylar Advisor releases, simplifying our offering for customers and providing broader and more powerful capabilities. Why This Change Matters Over the past 20+ years, ScienceLogic has continuously innovated and expanded through strategic investments and acquisitions. By consolidating our best-in-class offerings under the Skylar name, we: Simplifying our naming, reducing customer and market confusion Reflect tighter interoperability across products Deliver a more seamless, AI-driven experience This platform rebrand is about clarity, scale, and our long-term commitment to accelerating AI-led transformation. What to Expect Next You’ll start seeing Skylar naming convention across our website, content, Nexus Community, customer portal, products, and communications. Supporting resources, including documentation, certifications, training, and knowledge base articles, will be updated over time, aligned with product releases and version retirements, to minimize disruption. Need Help? For more details, please visit the Press Release and Skylar Renaming Page or reach out to your account team We’re excited to bring you along on this next chapter in our journey. The ScienceLogic Team View a special message from Dave Link and Douglas James.102Views2likes0Commentsevent_insight database
Is there somewhere documentation that explains tables in event_insight database. We would like to understand what are the alert_type and alert_category values used there. This database could be really interesting place to find for example alert statistics per organization or the noisiest collectors etc. Those things are otherwise pretty difficult to find.59Views1like2Comments
Documentation for creating custom credential types?
Hi, Is there some documentation available about how these custom credential types should be created and what different configuration options are available? Would be nice to have some documentation available where would be some instructions about different configuration possibilities available. For example what different type of fields I can create with this JSON configuration or how to configure regex validation for this specific field etc. Is there some documentation about this available or would it be possible to create one?Solved88Views1like7Comments
API Credentials
Hi, For onboarding a serous amount of new customers I would like to create a universal credential with the API. I am not able to find some documentation what to use for the payload. I have tried with the API browser in SL1 to post an update on an existing credential resulting in an error : "x-em7-status-message":"credential could not be updated". Any suggestion how to overcome this issue? Thanks in advance. Alfred HeijkoopSolved140Views1like3Comments